Blog Article
Beyond the blockchain: unlocking the power of analytics with Hubble
Author
Sydney Wiseman
Publishing date
Hubble
Data
Analytics
Did you know that the Stellar Development Foundation supports an open-source, publicly available analytics dataset? Hubble, SDF’s BigQuery dataset, offers a complete historical record of the Stellar blockchain without the headache of maintaining a full history database. By leveraging BigQuery, Hubble simplifies analytics questions that were previously impossible to solve with current tooling. This paradigm shift means Hubble is best suited for large-scale computing and complex data analysis instead of real time transaction processing. The dataset supplies developers and analysts with a comprehensive and reliable view of the Stellar network, empowering them to explore, analyze, and derive meaningful conclusions from the rich historical data.
With Hubble, users have newfound flexibility in querying data from the Stellar network, without the burden of storing the data themselves or accessing the data through an API. This opens up limitless potential for analytics and historical applications that were previously difficult to implement on Stellar.
In this blog post, we'll give an overview of Hubble, demonstrate how to access the dataset, and showcase examples that leverage historical data for blockchain analytics. Let’s unlock new insights by discovering hidden patterns on the Stellar network!
Overview of Hubble
Hubble is hosted on Google BigQuery, which allows anyone to connect to the dataset with a Google Cloud Project. Hubble stores two types of Stellar data: Transactional Data and Ledger State.
- Transactional Data contains transactional and operational event data executed in a given ledger. These tables publish a comprehensive, chronological order of events on the Stellar network.
- Ledger State tables answer the question: what did ledger entries look like after transactions and operations were applied? These tables are a snapshot of account, trustline and liquidity pool ledger entries at a given ledger.
This data model replicates the underlying model of the Horizon API so that accessing data from either source is simple. Although the data structures are the same, Hubble is the only place that stores snapshots of the Ledger State tables for every historical ledger. This is a powerful feature that gives the ability to replay events and simulate the ledger state at any point in time.
Hubble stays up-to-date through intraday batches that execute every 30 minutes. While it is possible to view recent transactions, it’s important to note that Hubble is not suitable for real-time use cases because it does not have the same availability objectives as Horizon.
We chose BigQuery because of its tremendous scalability and its role as a centralized hub for blockchain public datasets. BigQuery separates data storage from compute, which enables independent scaling of either component depending on needs. The Stellar dataset becomes easily accessible alongside other popular protocols, like Ethereum and Bitcoin, enabling cross-chain analytics and comparative studies between networks. While the Stellar Development Foundation maintains Hubble, all code is open source so that others can build their own data warehouse.
Accessing the data
There are two ways to access the Hubble dataset:
- BigQuery UI: The simplest way to explore Hubble is through the BigQuery UI. Users with a Google Cloud Project can follow the link to the dataset
crypto-stellar.crypto_stellar, browse the tables, preview the data, and run SQL queries directly within the BigQuery console. - BigQuery API Client Libraries: For programmatic access, developers can connect to
crypto-stellar.crypto_stellarusing the BigQuery API client libraries. These libraries allow you to integrate Hubble into applications, workflows, and analytics pipelines.
When accessing Hubble, it’s essential to understand the table organization so that you can fine-tune your queries. Several tables are large, and paying attention to table partitioning and clustering schemes will help improve query performance and reduce costs. To better understand the dataset, you can query the information schema, which retrieves metadata about tables, column names, and data types, or you can refer to our technical documentation, which catalogs table contents and their relationships.
Most tables in Hubble are partitioned monthly by batch_run_date, which is the 30 minute interval of ledgers processed and written to the dataset. This allows users to filter results by date, which can significantly reduce overall query costs and execution time. For example, if you are interested in tracking all payments for an asset minted in June 2022, you can limit the operations returned to those where batch_run_date >= “2022-06-01”, focusing on the relevant subset of data. Since the tables are partitioned monthly, users do not need to worry about date precision–any date within a month will incur the same processing costs.
Using the data
Let’s dive into some practical examples that demonstrate the value and potential of utilizing an analytics dataset. Hubble easily answers questions that would be very challenging to address with the Horizon API or Stellar Core.
Account History
Can we retrieve full transactional history for a specific Stellar account?
-- Query returns all payments sent and received for a particular
-- account. Replace "YOUR_ACCOUNT_ADDRESS" with the desired
-- Stellar Wallet address, with appropriate begin and end dates.
select
 op_source_account
 , transaction_hash
 , closed_at
 , type
 , `to`
 , `from`
 , asset_code
 , asset_issuer
 , asset_type
 , amount
 , source_asset_code
 , source_asset_issuer
 , source_asset_type
 , source_amount
-- enriched_history_operations is a flattened table containing
-- data from ledgers, transactions and operations tables
from `crypto-stellar.crypto_stellar.enriched_history_operations`
where
 (`to` = "YOUR_ACCOUNT_ADDRESS" or `from` = "YOUR_ACCOUNT_ADDRESS")
 -- Filter for operation types related to payments (direct and path)
 -- for more information on mappings, visit
 -- https://pkg.go.dev/github.com/stellar/go/xdr#OperationType
 and type in (1, 2, 13)
 and closed_at >= "BEGIN_DATE"
 and closed_at < "END_DATE"
 -- Failed transactions should not be included
 and successful is true
This query will fetch the full payment transaction history where the specified Stellar account is either the source or destination account for the transaction. These results can be used to assist with tax reporting, auditing, or for compliance purposes. While doing this in Horizon is possible, it’s painful and slow. You would need access to a Horizon instance with history dating back to the account’s creation, and then issue many paginated calls to the API to build the dataset. With Hubble, this data is returned in a single query!
Transaction Fee Analysis
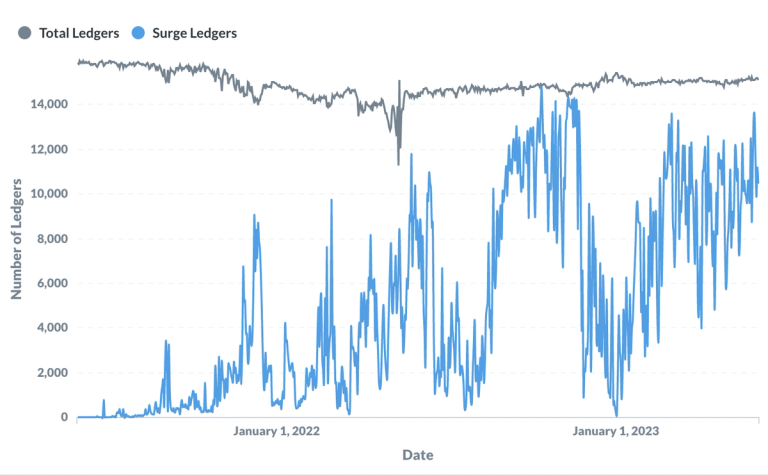
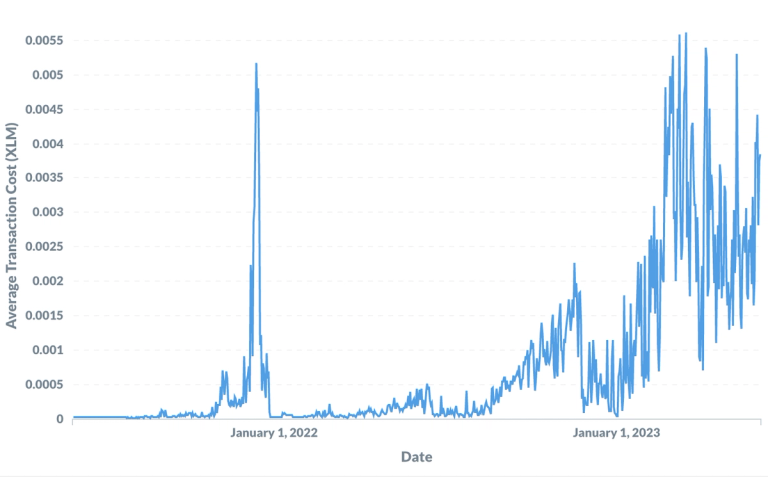
What’s the frequency of surge pricing on the Stellar network, and what’s the average transaction cost during these periods?
-- Query returns the average fee charged and number
-- of ledgers in surge pricing by day. This can be used
-- to study network conditions and inform fee strategy.
with
 surge_conditions as (
 select
 ledger_sequence
 , batch_run_date
 -- The minimum base fee for a transaction is 100 stroops.
 -- If the fee charged exceeds operation count * base fee, then
 -- the network was in a period of surge pricing. For more info:
 -- https://developers.stellar.org/docs/encyclopedia/fees-surge-pricing-fee-strategies
 , case
 when (tx.operation_count + if(tx.fee_account is not null, 1, 0)) * 100 < fee_charged
 then 1
 else 0
 end as surge_price_ind
 , avg(fee_charged) as avg_fee_charged
 from `crypto-stellar.crypto_stellar.history_transactions` as tx
 where
 tx.batch_run_date >= "2021-06-01"
 and tx.batch_run_date < "2023-06-04"
 group by
 ledger_sequence
 , batch_run_date
 , surge_price_ind
 )
select
 date(batch_run_date) as close_date
 , count(ledger_sequence) as total_ledgers
 , sum(surge_price_ind) as surge_ledgers
 -- Fees are reported in stroops. 1 XLM = 10,000,000 stroops
 -- The below converts the fee charged to XLM.
 , avg(avg_fee_charged) / 10000000 as avg_fee_charged
from surge_conditions
group by close_date
Using Hubble, we can profile the fee stats over a much larger time window than Horizon. Horizon only returns fee stats for the latest 5 ledgers, and Hubble allows the user to aggregate data over full history–46 million ledgers and counting! Profiling the data over a larger window allows the user to observe any periodicity of high network activity, optimize fee strategies, and predict future transaction costs. We analyzed the last two years of data, and it is obvious that transaction submissions to the network are increasing. Over 60% of all ledgers closed between Mar 2023 and June 2023 experienced surge pricing.

This type of analysis can help explain why an application experiences a drop in the number of their transactions included in a ledger. If the max fee is not set high enough, the average transaction cost may be pricing them out inclusion in the transaction set.

Comprehensive Asset Analysis
Can we analyze an asset’s liquidity, adoption and distribution on the Stellar Network? For the purposes of this example, let’s analyze Stellar’s native asset, XLM.
First, let’s measure the circulating supply of the asset. Circulating supply by itself isn’t a good measure of the liquidity of the asset, so we could ask some additional questions. Is the asset distributed across many accounts or few? Is the asset locked in inactive accounts, or is it freely moving across accounts?
-- Return only trust line balances for XLM.
-- The ledger tables save all trust lines, even
-- deleted ones, so filter out the deleted trust lines.
-- NOTE: XLM balances are stored in the accounts table.
-- Every other asset balance is stored in the trust_lines table.
with
 filter_by_asset as (
 select
 account_id
 , balance
 , last_modified_ledger
 , closed_at as last_modified_ts
 from crypto-stellar.crypto_stellar.accounts_current
 where
 deleted is false
 )
 -- Calculating the circulating supply by summing all balances
 , total_supply as (
 select
 sum(balance) as circulating_supply
 , count(account_id) as total_trustlines
 from filter_by_asset
 )
 -- Filter out the top ten accounts by balance
 , top_ten_accounts as (
 select
 account_id
 , balance
 from filter_by_asset
 order by balance desc
 limit 10
 )
 , inactive_supply_365d as (
 select sum(balance) as inactive_supply
 from filter_by_asset
 -- Each trust line contains a timestamp when it was last modified.
 -- Changes in balance count as a modification.
 where last_modified_ts <= timestamp_sub(current_timestamp, interval 365 day)
 )
select
 ttl_supply.total_trustlines
 , ttl_supply.circulating_supply
 , inactv_supply.inactive_supply
 , (inactv_supply.inactive_supply / ttl_supply.circulating_supply) as pct_supply_inactive
 , sum(top_acct.balance) as top_ten_account_supply
 , sum(top_acct.balance) / ttl_supply.circulating_supply as pct_supply_top_ten
from total_supply as ttl_supply
join inactive_supply_365d as inactv_supply
 on 1 = 1
join top_ten_accounts as top_acct
 on 1 = 1
group by
 ttl_supply.total_trustlines
 , ttl_supply.circulating_supply
 , inactv_supply.inactive_supply
 , pct_supply_inactive
At first glance, it seems like XLM is hyper-concentrated amongst the top ten asset holders. This metric, however, is misleading because it includes the 55B of XLM burned in 2019. Context is important when assessing asset performance!
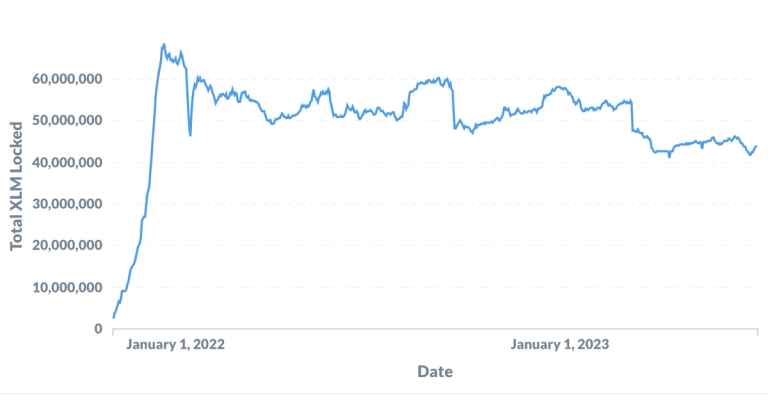
XLM is also a popular asset for AMMs. Can we track the total XLM locked in all liquidity pools over time?
-- Find liquidity pools where XLM is one of the assets in the pool.
-- Deleted liquidity pools should not be included.
with
filter_amms_by_asset as (
select liquidity_pool_id
from `crypto-stellar.crypto_stellar.liquidity_pools_current`
where (asset_a_type = 'native' or asset_b_type = 'native')
and deleted is false
)
-- Multiple pools contain XLM. Calculate the average
-- XLM locked per pool, per day.
, calculate_tvl as (
select
lps.liquidity_pool_id
, concat(lps.asset_a_code, ':', lps.asset_b_code) as asset_pair
, date(hl.closed_at) as ledger_date
-- Asset positions are determined by the asset id.
-- Check both Asset A and Asset B for XLM.
, case when lps.asset_a_type = 'native' then avg(lps.asset_a_amount)
else avg(lps.asset_b_amount) end as usdc_amount
from `crypto-stellar.crypto_stellar.history_ledgers` as lps
join filter_amms_by_asset as amms
on lps.liquidity_pool_id = amms.liquidity_pool_id
join `crypto-stellar.crypto_stellar.history_ledgers` as hl
on lps.last_modified_ledger = hl.sequence
group by
lps.liquidity_pool_id
, asset_pair
, ledger_date
, lps.asset_a_type
)
select
ledger_date
, sum(usdc_amount) as total_usdc_locked
from calculate_tvl
group by ledger_date
To answer this type of question using Horizon, you would have to replay each liquidity pool withdrawal and deposit beginning at the pool’s creation and calculate the cumulative sum manually. Since Hubble stores snapshots of all ledger states, you can simply plot the balances over time.

As of July 2023, there is currently ~45M XLM locked in all liquidity pools on the Stellar network. By plotting total value locked over time, it is easy to observe when AMMs launched and understand how XLM impacts liquidity across all pools.
What’s in focus for 2023?
Soroban support is coming to Hubble! Hubble will support the Testnet and Mainnet upgrades later this year. This means that developers will be able to monitor contract usage, identify top invoked contracts, diagnose common failure points, and more.
Whether you’re an analyst, developer, or business user, Hubble has got you covered. It is not just another data source; it is a game-changing data warehouse that propels Stellar to the forefront of top-tier blockchain analytics. By harnessing the power of BigQuery, users can ask complex, data-intensive questions or access the full historical record of events without the overhead of running an Horizon instance. With an easy-to-use interface and well-supported Cloud SDKs, you have the flexibility to access Stellar network data however you’d like, with the benefit of only paying for query costs. The possibilities for Hubble are endless: analysts can answer ad hoc questions, developers can extract raw historical data for reconciliation, business users can connect data visualization tools to build dashboards, or data scientists can train ML models by building robust, complete training datasets.
We’re excited about the transformative potential that Hubble brings to Stellar. Try it out, and let us know what you uncover!
Questions, feedback or feature requests? Join our Stellar Developer Discord channel, #data-analytics.